Build a Better JIRA Dashboard in 6 Steps

Share
Building a JIRA dashboard to encompass all projects and team members can be challenging in an agency. We have multiple projects of differing scope and scale running at the same time using various agile methodologies. The dashboard needs to give team members and stakeholders an overall sense of the work we’re doing, as well as motivation to act to move the project forward. Check out these six steps you can take (we did!) to supercharge your JIRA dashboard and make it more useful for everyone.
1. Start by gathering requirements.
As with any good project, it’s important to know what your goals are. In our team, members who have been working in our JIRA instance for quite some time had a pretty good idea of what they wanted to see. We wanted to get a system-wide view of all JIRA activities that would provide value to project managers and team members alike.
If you don’t have this knowledge built in (or even if you do), consider surveying team members to get a sense of what various users might want to get out of the dashboard. You never know what great ideas might surface from simply asking!
2. Review JIRA gadgets to see what you can use.
Next, we did a quick review of the various gadgets at our disposal to see which might best accomplish our goals. Atlassian includes several gadgets out-of-the-box and there are also extension gadgets you can install. There’s even the option to create a custom gadget! There’s lots of room for flexibility and personalization here, but start small and grow as the need arises and there’s additional buy in for the additional time or money investment.
3. Experiment with the System Dashboard.
Now that we had a sense of what our users wanted and what was readily available to us, we started experimenting with changes to the System Dashboard. To navigate to the Configure System Dashboard page:
- Choose Settings > System.
- Under User Interface heading, select System dashboard to open the Configure System Dashboard page.
Next, play with visuals.
We wanted to visualize our work via charts or graphs to get the sense of the bigger, system-wide picture. We wanted to get a sense of the workload on our team members, both individually and teamwide.
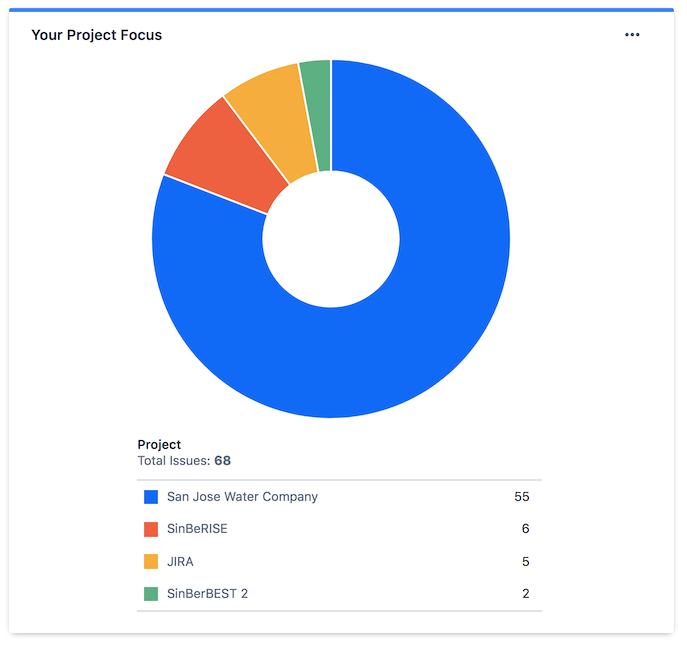
This pie chart includes all projects a user is working on with the percentages of the pie determined by the number of issues assigned.;
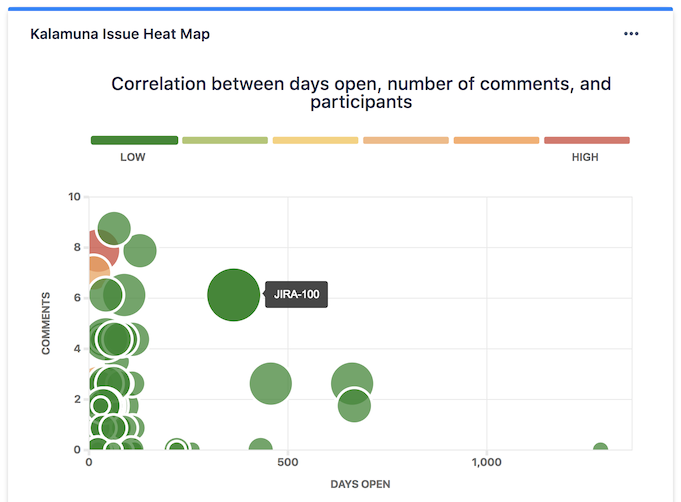
To encourage action on issues that may be sticking around, we included an issue heat map organized by days opened. This shows us what issues have been open for a while and need to be addressed. It also links out to specific issues.
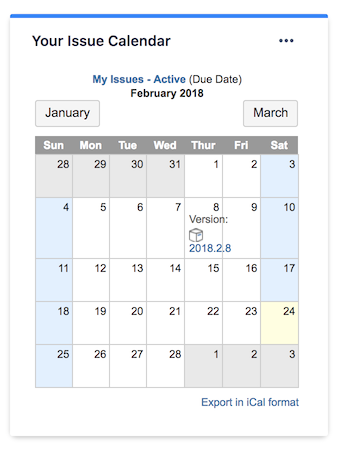
Have fun with calendars.
For our projects that aren’t using scrum methodology and organizing work into sprints, we often assign due dates to issues. Including a calendar view with the due dates plotted on it is super helpful for users as they prioritize their work for the week.
Get crazy with filters.
Gadgets offer some great options for looking at different data points. We made use of additional filters and used JQL to show what’s really important to our team. We found that we had to customize a user’s assigned opened issues. Out of the box it was showing closed issues, too. We also needed to filter out test and archived projects to make sure the dashboard was as clean and actionable as possible.
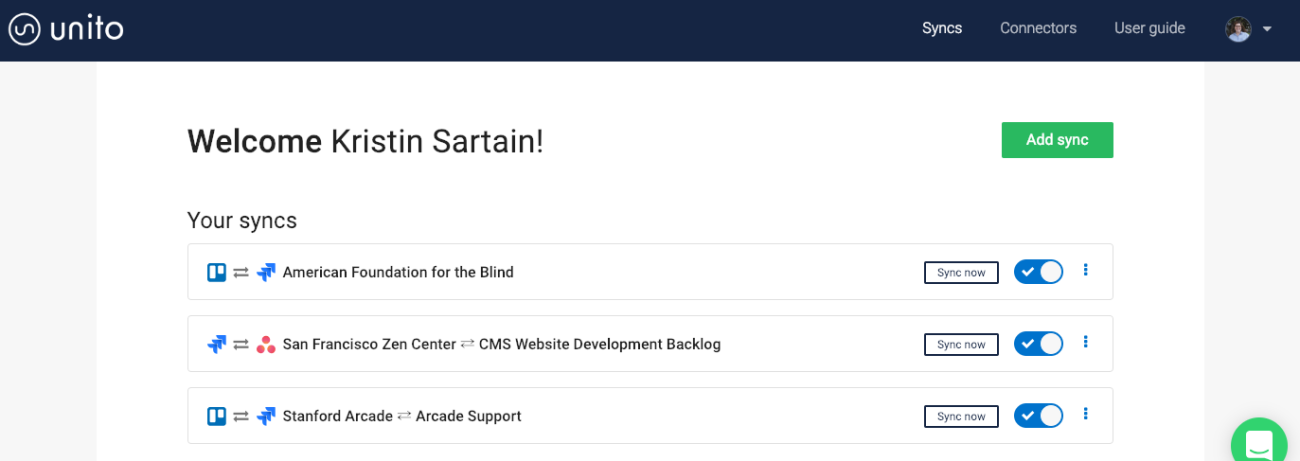
Tie-in with other platforms.
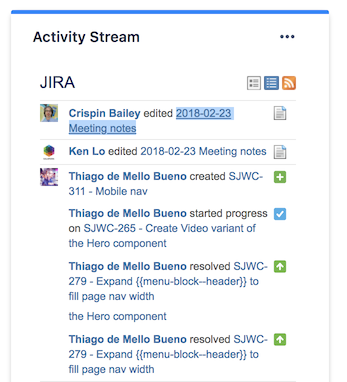
Our team also uses Confluence for documentation in conjunction with JIRA. Including the Confluence activity stream was a great way to enhance visibility of edits and additions in various Confluence spaces.
4. Consider the layout.
Once we had all the gadgets figured out and configured to our liking, we wanted to determine how the gadgets would appear on the screen. JIRA offers a few different layout options to organize the page. We chose the right sidebar layout. The main content area focuses on the individual user and their open issues and priorities. The right sidebar houses team-wide information and the Confluence activity stream.
5. Copy the System Dashboard.
We got the layout looking good and made the dashboard live. It’s helpful to have a working copy of the System Dashboard where you can make tweaks and changes without impacting the team. Then you can duplicate changes in the System Dashboard and keep a copy as a testing ground.
6. Let your team know about your awesome JIRA dashboard.
Once the Dashboard was up and running we notified the team of the changes so they were aware of the new resource available to them and also requested feedback on the Dashboard so we can continue to evolve it to fit the needs of our users.
Here’s some documentation from Atlassian on how to work with Dashboards:
Happy JIRA-ing!

Kristin Sartain
Along with leading our team of account and project managers, Kristin manages select projects herself. She brings her whole self to her role, including significant experience working with universities, nonprofits, and community organizations. After she takes her trusty headset off for the day, she may be found wrangling her beloved twin toddlers, dog, and husband while sipping on gin and tonics with extra lime.