Google Analytics Tips + Best Practices Part 3: A Sea of Metrics

Share
Google Analytics is a powerful tool that gives you the ability to slice and dice your website traffic in many ways, with plenty of metrics and dimensions to choose from. If you are just starting with Google Analytics, it's likely that you are a bit overwhelmed by all the metrics that are available to you. We will cover the basics for you, as well as explain what to use and when to use them.
For this installment we are going to focus on 2 areas. The first is the mythical bounce rate, and why it’s not that important. The second is the relationship between pageviews, sessions and users.
Bounce rate - Does my content suck?
By now, you have no doubt read countless blogs, all telling you that you should carefully monitor your bounce rate. Too high and “oh no!”, you think your site sucks. The reality is very different. The first thing to avoid is using a single metric to determine success (not failure… at Kalamuna we are all optimists). There is a reason Google Analytics gives us so many metrics, so use them! Evaluate your site based on metrics that relate to one another, or better yet, create goals based on your business objectives.
All a bounce rate shows is how many sessions (as a %) only had 1 pageview in them. In other words, someone came to a page and did not go to another page. Why is this a bad thing? If you are a content heavy website, you likely have a high bounce rate. Why? Because it's very common for someone to look for something specific, find it via Organic Search, read it (thoroughly enjoy it of course) and leave. They got exactly what they were looking for, pat yourself on the back! By default, bounce rate does not take into consideration how long someone spends on a page or how much they enjoy it (for qualitative surveys, use a tool like Hotjar). Notice how I said by default.
Bounce rate can be be impacted by a lot of different things aside from seeing another page. In fact, we have had clients with bounce rates between 1-2%, isn't that great? Unfortunately a sloppy implementation of Google Analytics via Google Tag Manager (GTM), can often lead to a misleading bounce rate. The reason is that an event, if set to Non-Interaction=False, can change the bounce rate.
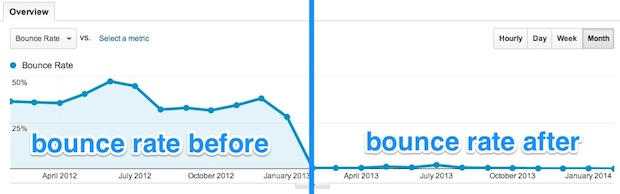
Image credit: RocketFuel
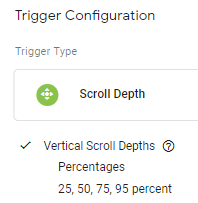
Next is an example we have seen in the past. Scroll Tracking has been implemented via GTM. The Non-Interaction settings has not been modified, so it's “False” by default. The event triggers at 25%, 50%, 75%, and 100%.
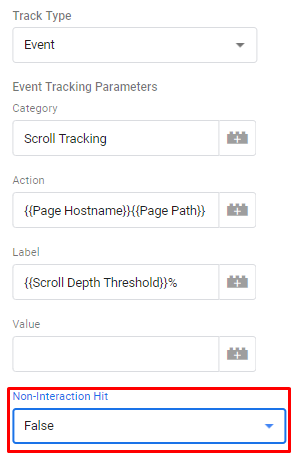
Whenever this event fires, and it will trigger for most people as 25% of the page is typically visible for most users, it will count towards the bounce rate. This means that even if a person only visited 1 page and did not scroll at all, since 25% of the screen was visible, the event was fired, and this was no longer a bounce. Whenever analyzing your results you should be mindful of how your data is being collected and question its integrity. If it doesn't feel right, it probably isn't.
In a nutshell:
- Bounce rate does not mean good or bad, it's just a metric that should be used in conjunction with other metrics.
- Bounce rate can be easily manipulated or accidentaly fudged by a poor implementation of GTM.
- Do not bother with industry benchmarks, they are completely irrelevant.
- Create your own KPIs that are tied to business objectives and measure success based on that

Six degrees of metrics - How users, sessions, and pageviews are all connected.
It’s hard to describe the relationship between metrics without getting a tiny bit technical, so please bare with me, it won’t be long. Anytime you visit a site (and don’t have ad blocking turned on) you send a hit to Google Analytics. If it’s the first time you have visited the site, a cookie is created in your browser/device. If you have been to the site before, it simply appends information to the existing cookie. Everything starts with a hit.
The first time you visit a site and a hit is sent, you now count as 1 user, having 1 session, and triggering 1 pageview. If you visit another page, the pageview counter goes up. Take note that all 3 metrics need to be understood within a specific time range.
For the sake of clarity, let’s use the month of March for the following example:
| Date | Action | User | Session | Pageview | Unique Pageview |
|---|---|---|---|---|---|
|
March 1 |
Landed on Homepage | 1 | 1 | 1 | 1 |
| March 1 9:05 PM |
Started reading a blog post | 1 | 1 | 2 | 2 |
| March 1 9:06 PM |
Accidentally refreshed the page | 1 | 1 | 3 | 2 |
| March 5 3:00 PM |
Landed on Homepage | 1 | 2 | 4 | 2 |
| March 10 5:00 PM |
Went back to the same blog post | 1 | 3 | 5 | 2 |
User
As long as you don’t clear your cookies and keep using the same browser/device, you will always register as 1 user in Google Analytics. There is a reason this metric used to be called Unique Users a few years ago.
Session
By default a session is a 30 minute span of time, in which a user is active. As a user, you can go to a site daily, and you will register 31 sessions (March 2019, has 31 days). Sessions are not about how much content you saw, it simply shows how many times you came. The reason 30 minutes is important, is that many people open lots of tabs and forget about them. Thirty minutes acts as a timer, and if there is no activity in a given window, it ends the session. A session also ends at midnight, but we will ignore that for the time being.
Pageviews
This is the easiest to describe. Anytime a page is viewed, this increments by one. Did your mouse get stuck and you accidentally refreshed the page 30 times? Yup, that is 30 pageviews.
Unique Pageviews
To avoid counting 30 pageviews, we can use the Unique Pageview metric. One that I highly recommend you use over Pageviews. Unique Pageviews deduplicates the count, if you saw the same page multiple times. In my example above, there were 5 Pageviews but only 2 Unique Pageviews.
In short, when trying to understand how your site is performing, look at all 4 metrics in conjunction as they are so closely related. Don’t just use Pageviews because that looks like the highest number.
Parting words - A single metric does not define success
In conclusion, I encourage you to dive in and utilize all that Google Analytics has to offer. If you get lost, that's a good thing, it means you are on the learning path. Just remember that a single metric does not define success. Start with understanding the business objective, create some goals that ladder up, and use those instead of vanity metrics such as bounce rate.
There are a tons of resources out there to support you, Kalamuna being one of them. We would be happy to assist you in any way, just reach out.
Have fun, be thoughtful, and measure success!

Vadim Tchernine
Vadim is our resident data artist, uncovering truths hidden within metrics and displaying them in surprising, actionable ways. With his 10+ years of experience working in analytics, Vadim can tame the most behemoth of datasets to tell the real story about how your digital concern lives in the world, giving you the insights you need to make sound strategic decisions.