Understand Analytics with a Free Google Data Studio Report

Share
Are you a marketing or IT manager who’s confused when navigating Google Analytics? Wish you could see only key performance indicators in one place? Or, do you want to share only some of your data in an automatically updated report? Kalamuna has created a Google Data Studio (GDS) report template to help our clients better visualize their data, and because part of our mission is to help colleges and universities meet their goals through technology, we’re creating free reports for higher-ed professionals now until April 30. Read on to see what our GDS can do for you, and get your free report.
Google Analytics (GA) is a powerful tool, but it can be unwieldy and inscrutable to the uninitiated. The interface offers a ton of information, but how do you know where to quickly find what you need? How do you share a snapshot of a certain metric with stakeholders? And, how do you make sure that everyone’s looking at the same data—particularly when that data is actively changing? To address these problems, Google developed Data Studio. It turns analytics data into simple, shareable, easy-to-understand reports through data visualization. It also can pull in data from other sources like Facebook.
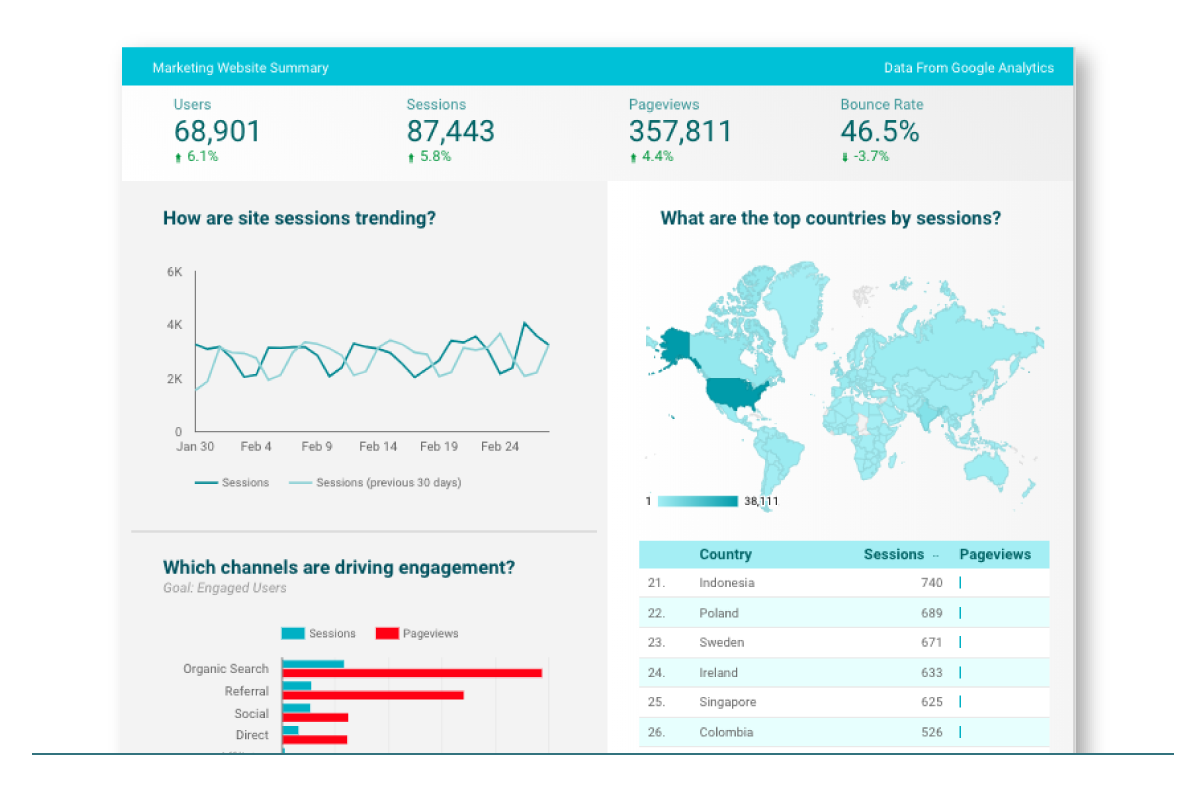
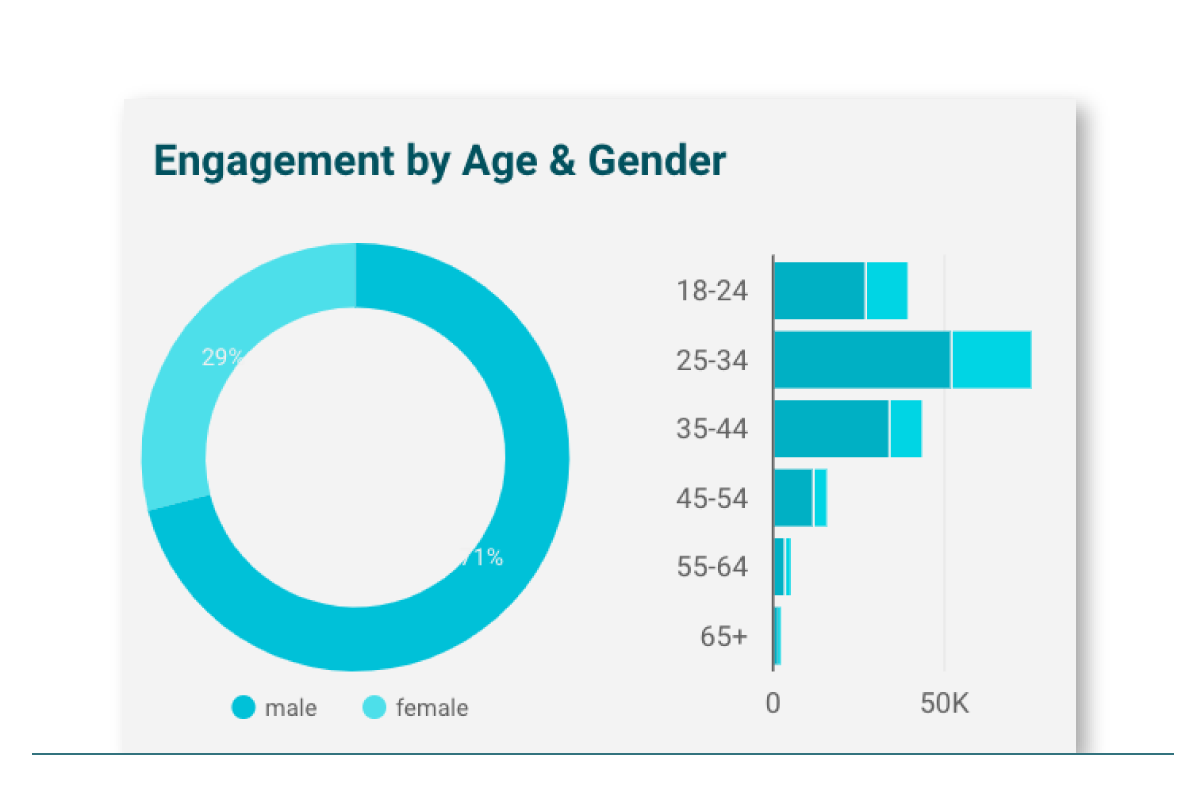
Look! Easy-to-Understand Data Visualizations
With so many numbers crunched and visualized, Google Analytics can make you think the work is over, and that now all you see are “answers,” but that’s not true. There’s a lot to get through and the work of gleaning takeaways is hardly over; GA’s data categories hold many, many subcategories, all configurable to the nth degree. It’s not always easy to know what you’re looking at. GDS simplifies and clarifies information so that professionals of any discipline can understand it.
Share Analytics Quickly and Easily without a Login
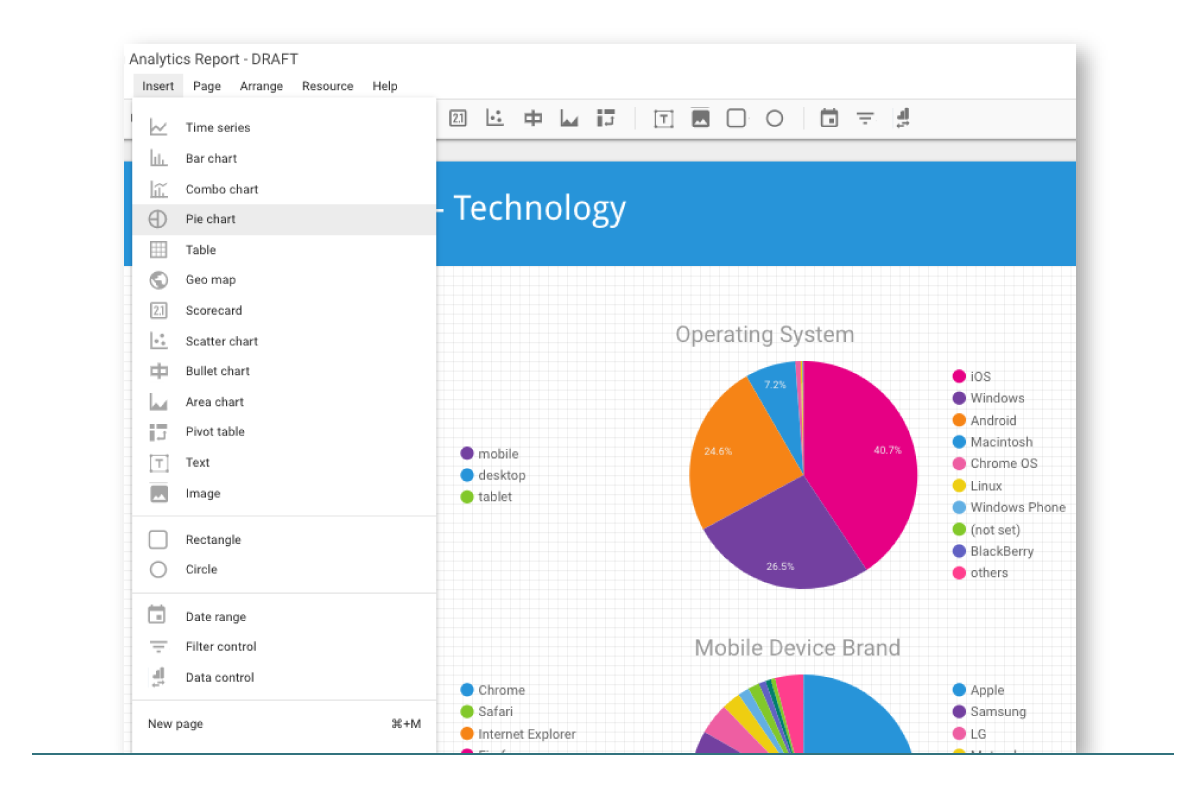
Imagine needing to share the percentage of site visitors using a mobile device with a freelance designer. You log in to your Analytics account, run a report, and screenshot a pie chart and email it over. Your freelancer is thankful, but then asks what this data looks like for August. Login. Screenshot. Email. Another question arises. Login. Screenshot. Email. You wish you could grant them full access to your Analytics account, but policy says otherwise. With GDS, your mobile report can dynamically display information on custom time periods.
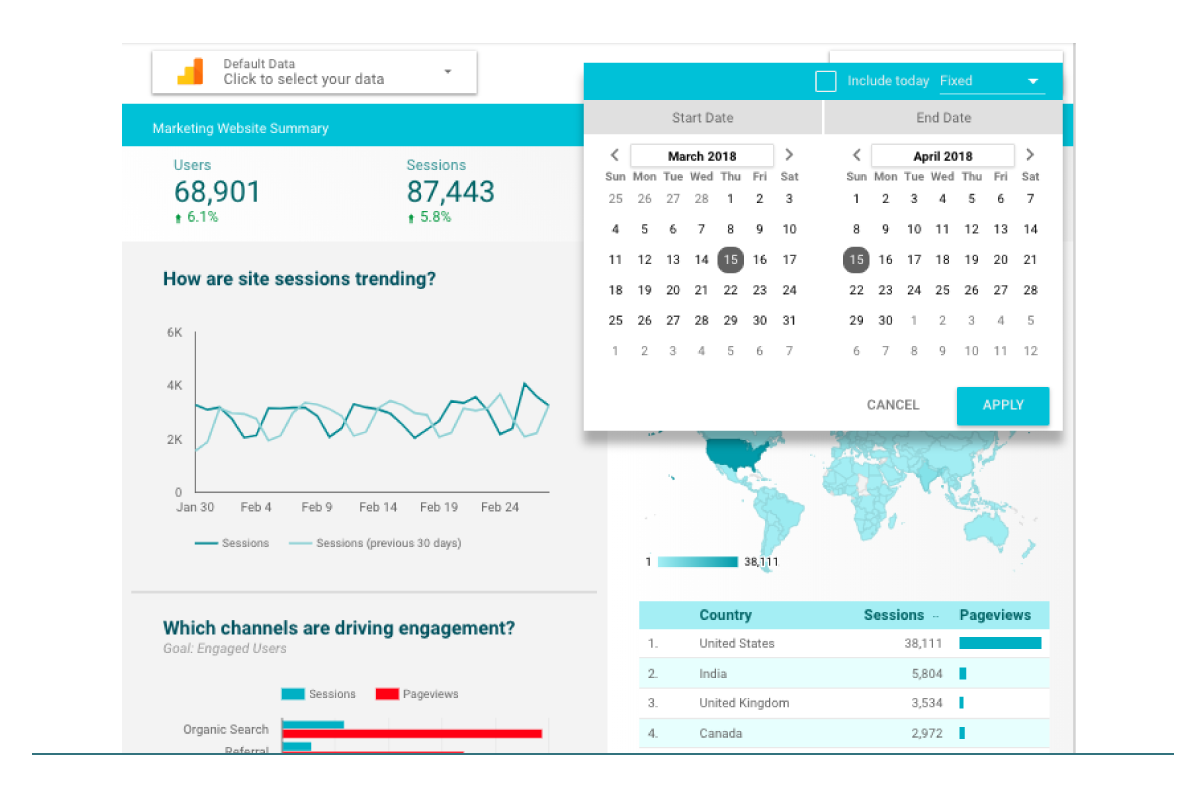
See and Share Always-Up-to-Date Metrics
Now, let’s focus on the word “dynamic,” which means “characterized by constant change, activity, or progress.” In the context of GDS, “dynamic” means you not only never have to share Google Analytics login credentials with anyone, but that when you share a GDS report, it will always display the most current data. Every time you or a colleague views a report, it’s updated.
Collaborate on Reports in Real Time
It’s a given that we can collaborate in real-time on almost any Google interface. This functionality helps us merge minds and together, get things done with amazing speed. Similarly, GDS enables multiple teammates to edit a single report at the same time. On clear, beautiful slides, you can now add or modify widgets, change fonts and styling, add pages and more.
See Data from Almost Any Source, Including Facebook, and Just about Anything Else
Yes. It’s true, and it’s awesome: You can pull whatever data you have on a Google Sheet into Google Data Studio. This means you can pull in social media and other numbers and look at them in the same context as your website analytics. You can also pull in Google Analytics data from multiple web properties into the same report. Even more, with GDS’s “Data Connectors,” you can pull data directly from almost any online data source without needing to export as a spreadsheet. In addition to the default data connectors (which includes YouTube and Adwords), Google has created a "Community Connectors" library where people/companies can share connectors to other services like Facebook, Amazon, MailChimp, Twitter, etc. You can have it all!
The information you need to make the right decisions about your site and other online communications is available and free. But until now, that information wasn’t presented in a way that was easy for busy people to quickly act on it. We’ve seen clients use clear, dynamic GDS reports to save time and connect the dots to make sound design, messaging and content strategy decisions with lightning speed. Be one of them—sign up for your free report now.

Andrew Mallis
If you’ve encountered Kalamuna, you’ve likely experienced genuine care and expert guidance that starts with our thoughtful CEO and cofounder, Andrew. Along with an infinite stockpile of dad jokes, he brings his background in visual arts and activism to his work – leading us to drive great missions further.